Know what gets read.
See what comes next.
See what gets read, what gets skipped and what readers say about it. Follow active reading time, scroll depth and feedback, then see which pages show up on the way to your signup and demo goals. Give your next editorial meeting some evidence.
Your website. Your content. Your brand.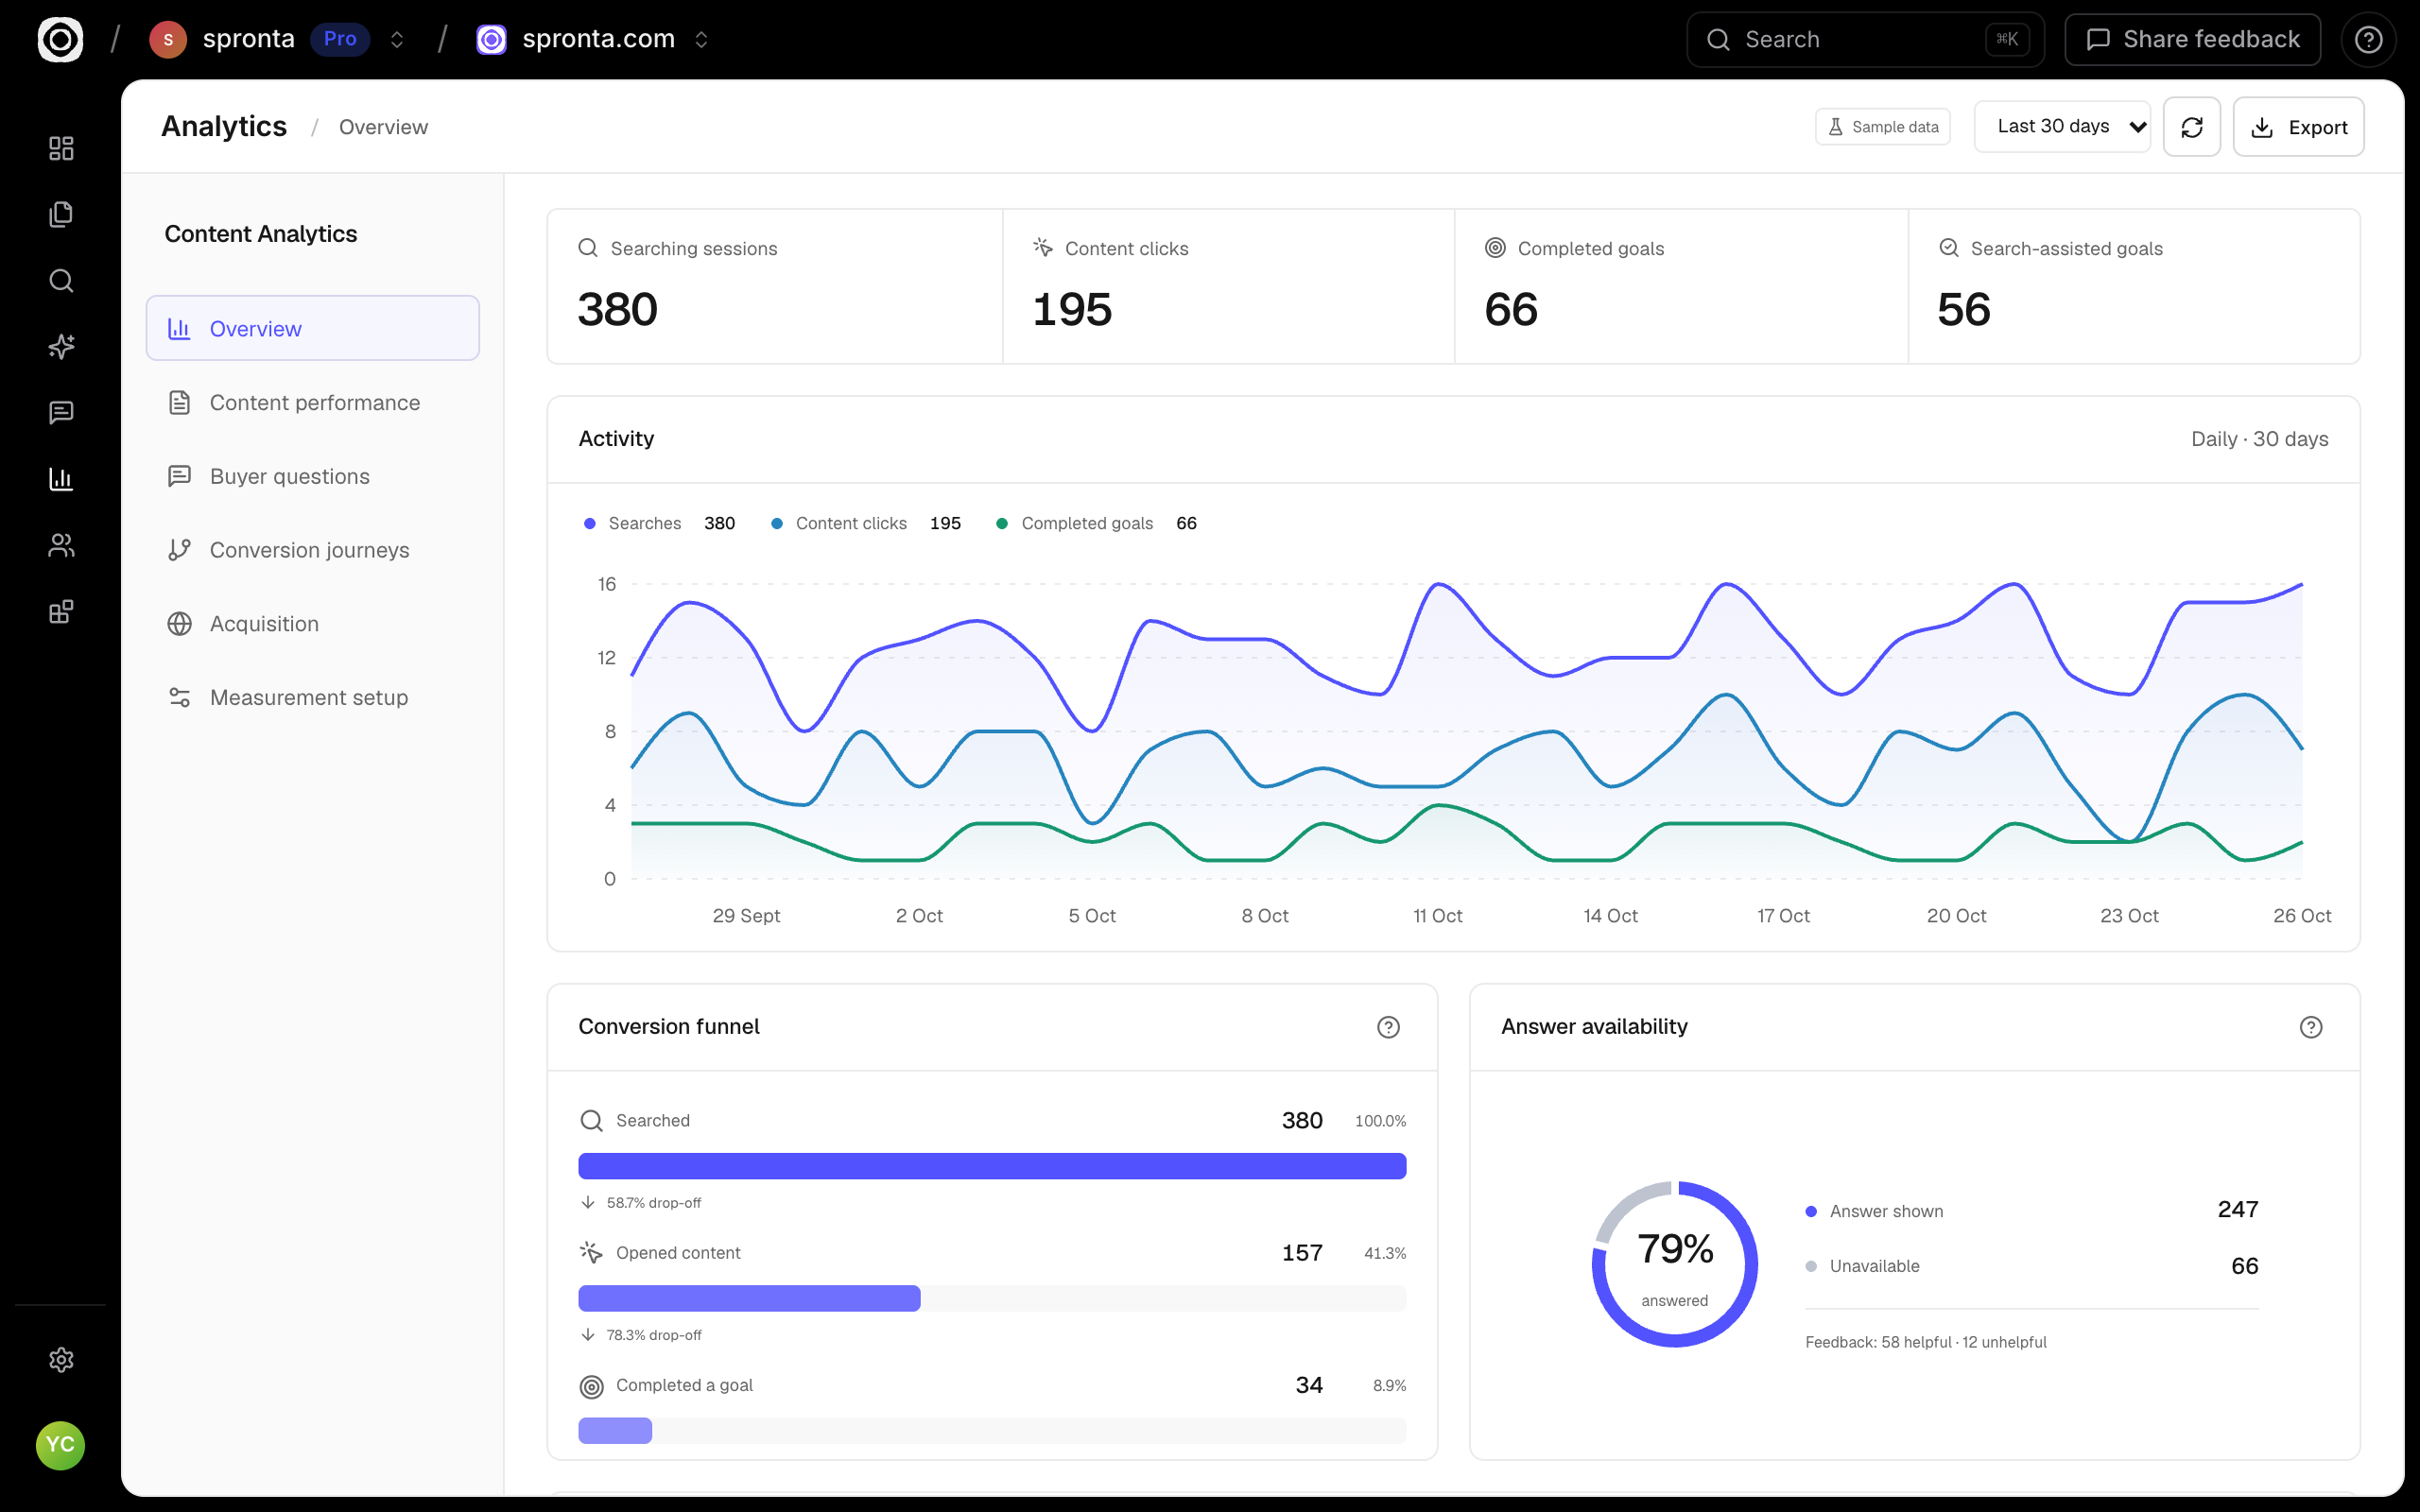
Your content has a job to do. Know what it drives.
Find buying intent.
See the product, pricing, and integration questions visitors ask when they are considering their next step.
Connect it to an outcome.
Use Content Analytics and your configured goal events to connect discovery journeys to signups and demos.
Write the next useful thing.
Use reading and feedback signals to spot what deserves a refresh. Check CRM outcomes before declaring a page your new star salesperson.
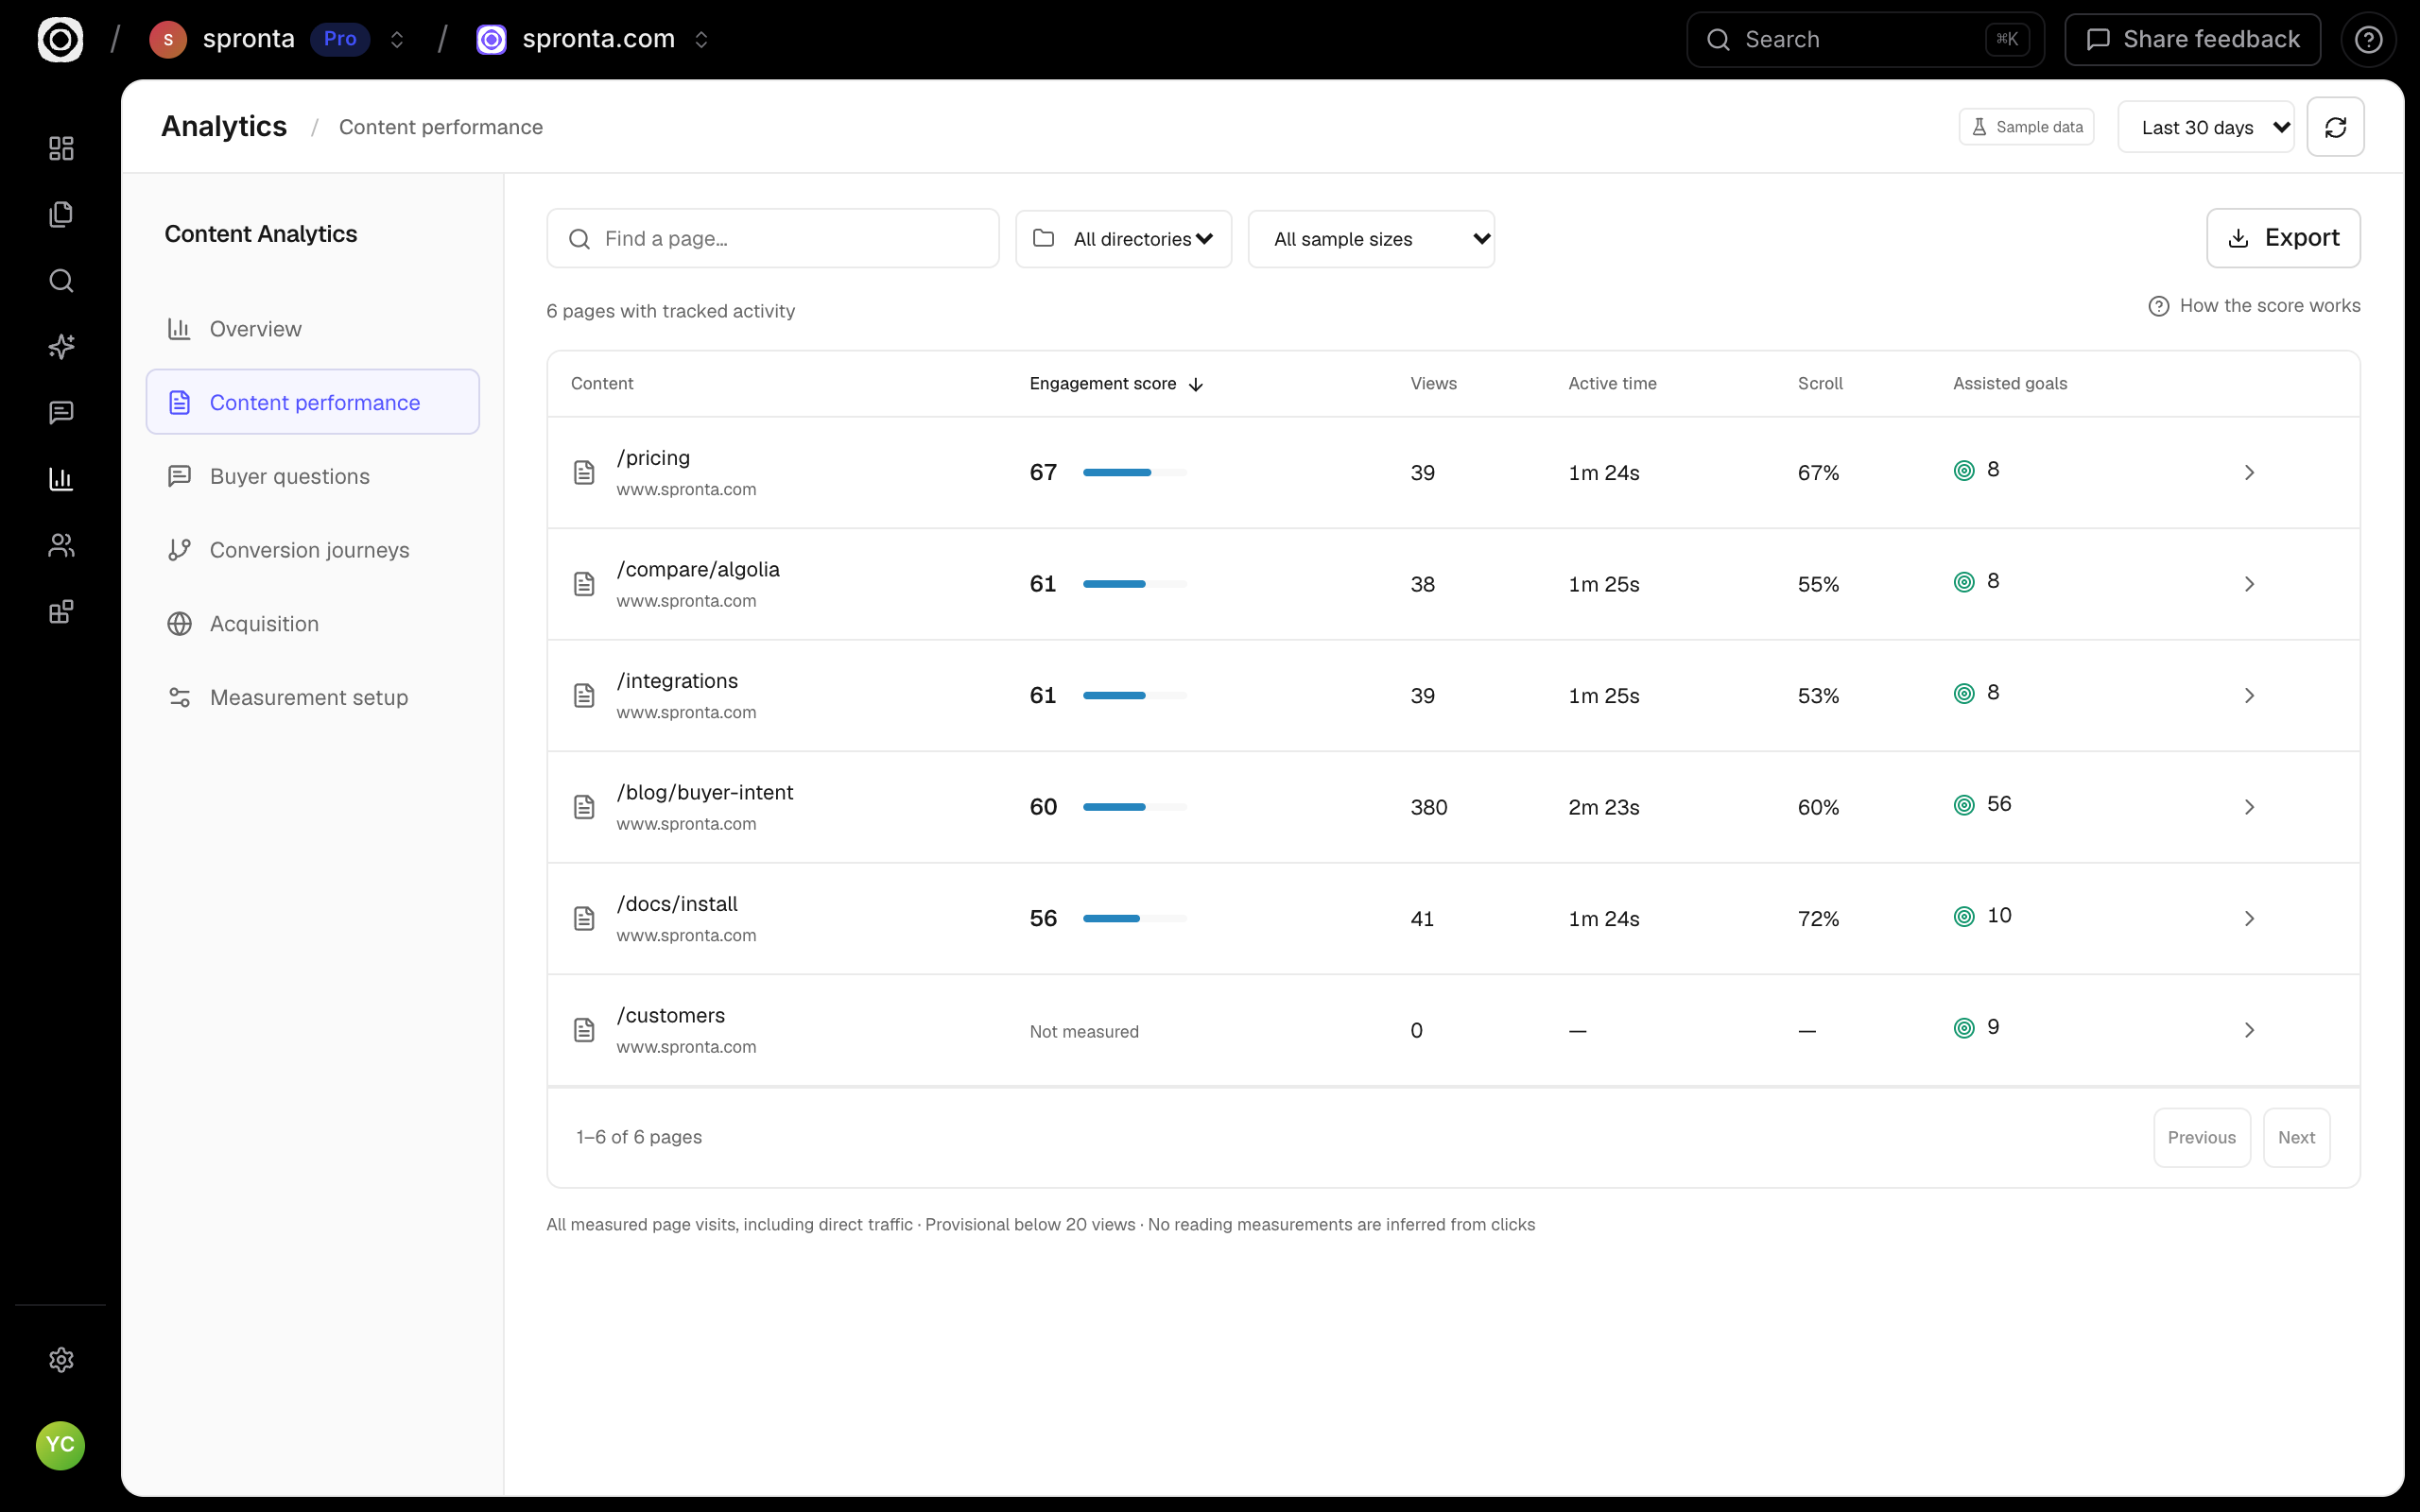
Find the pages that deserve your attention.
Explore your content by page or directory. Compare measured views, active reading, scroll depth and tracked goal assists in one compact table.
- Search and filter your content library
- Sort by engagement, reading time or goals
- Open a page to investigate the detail
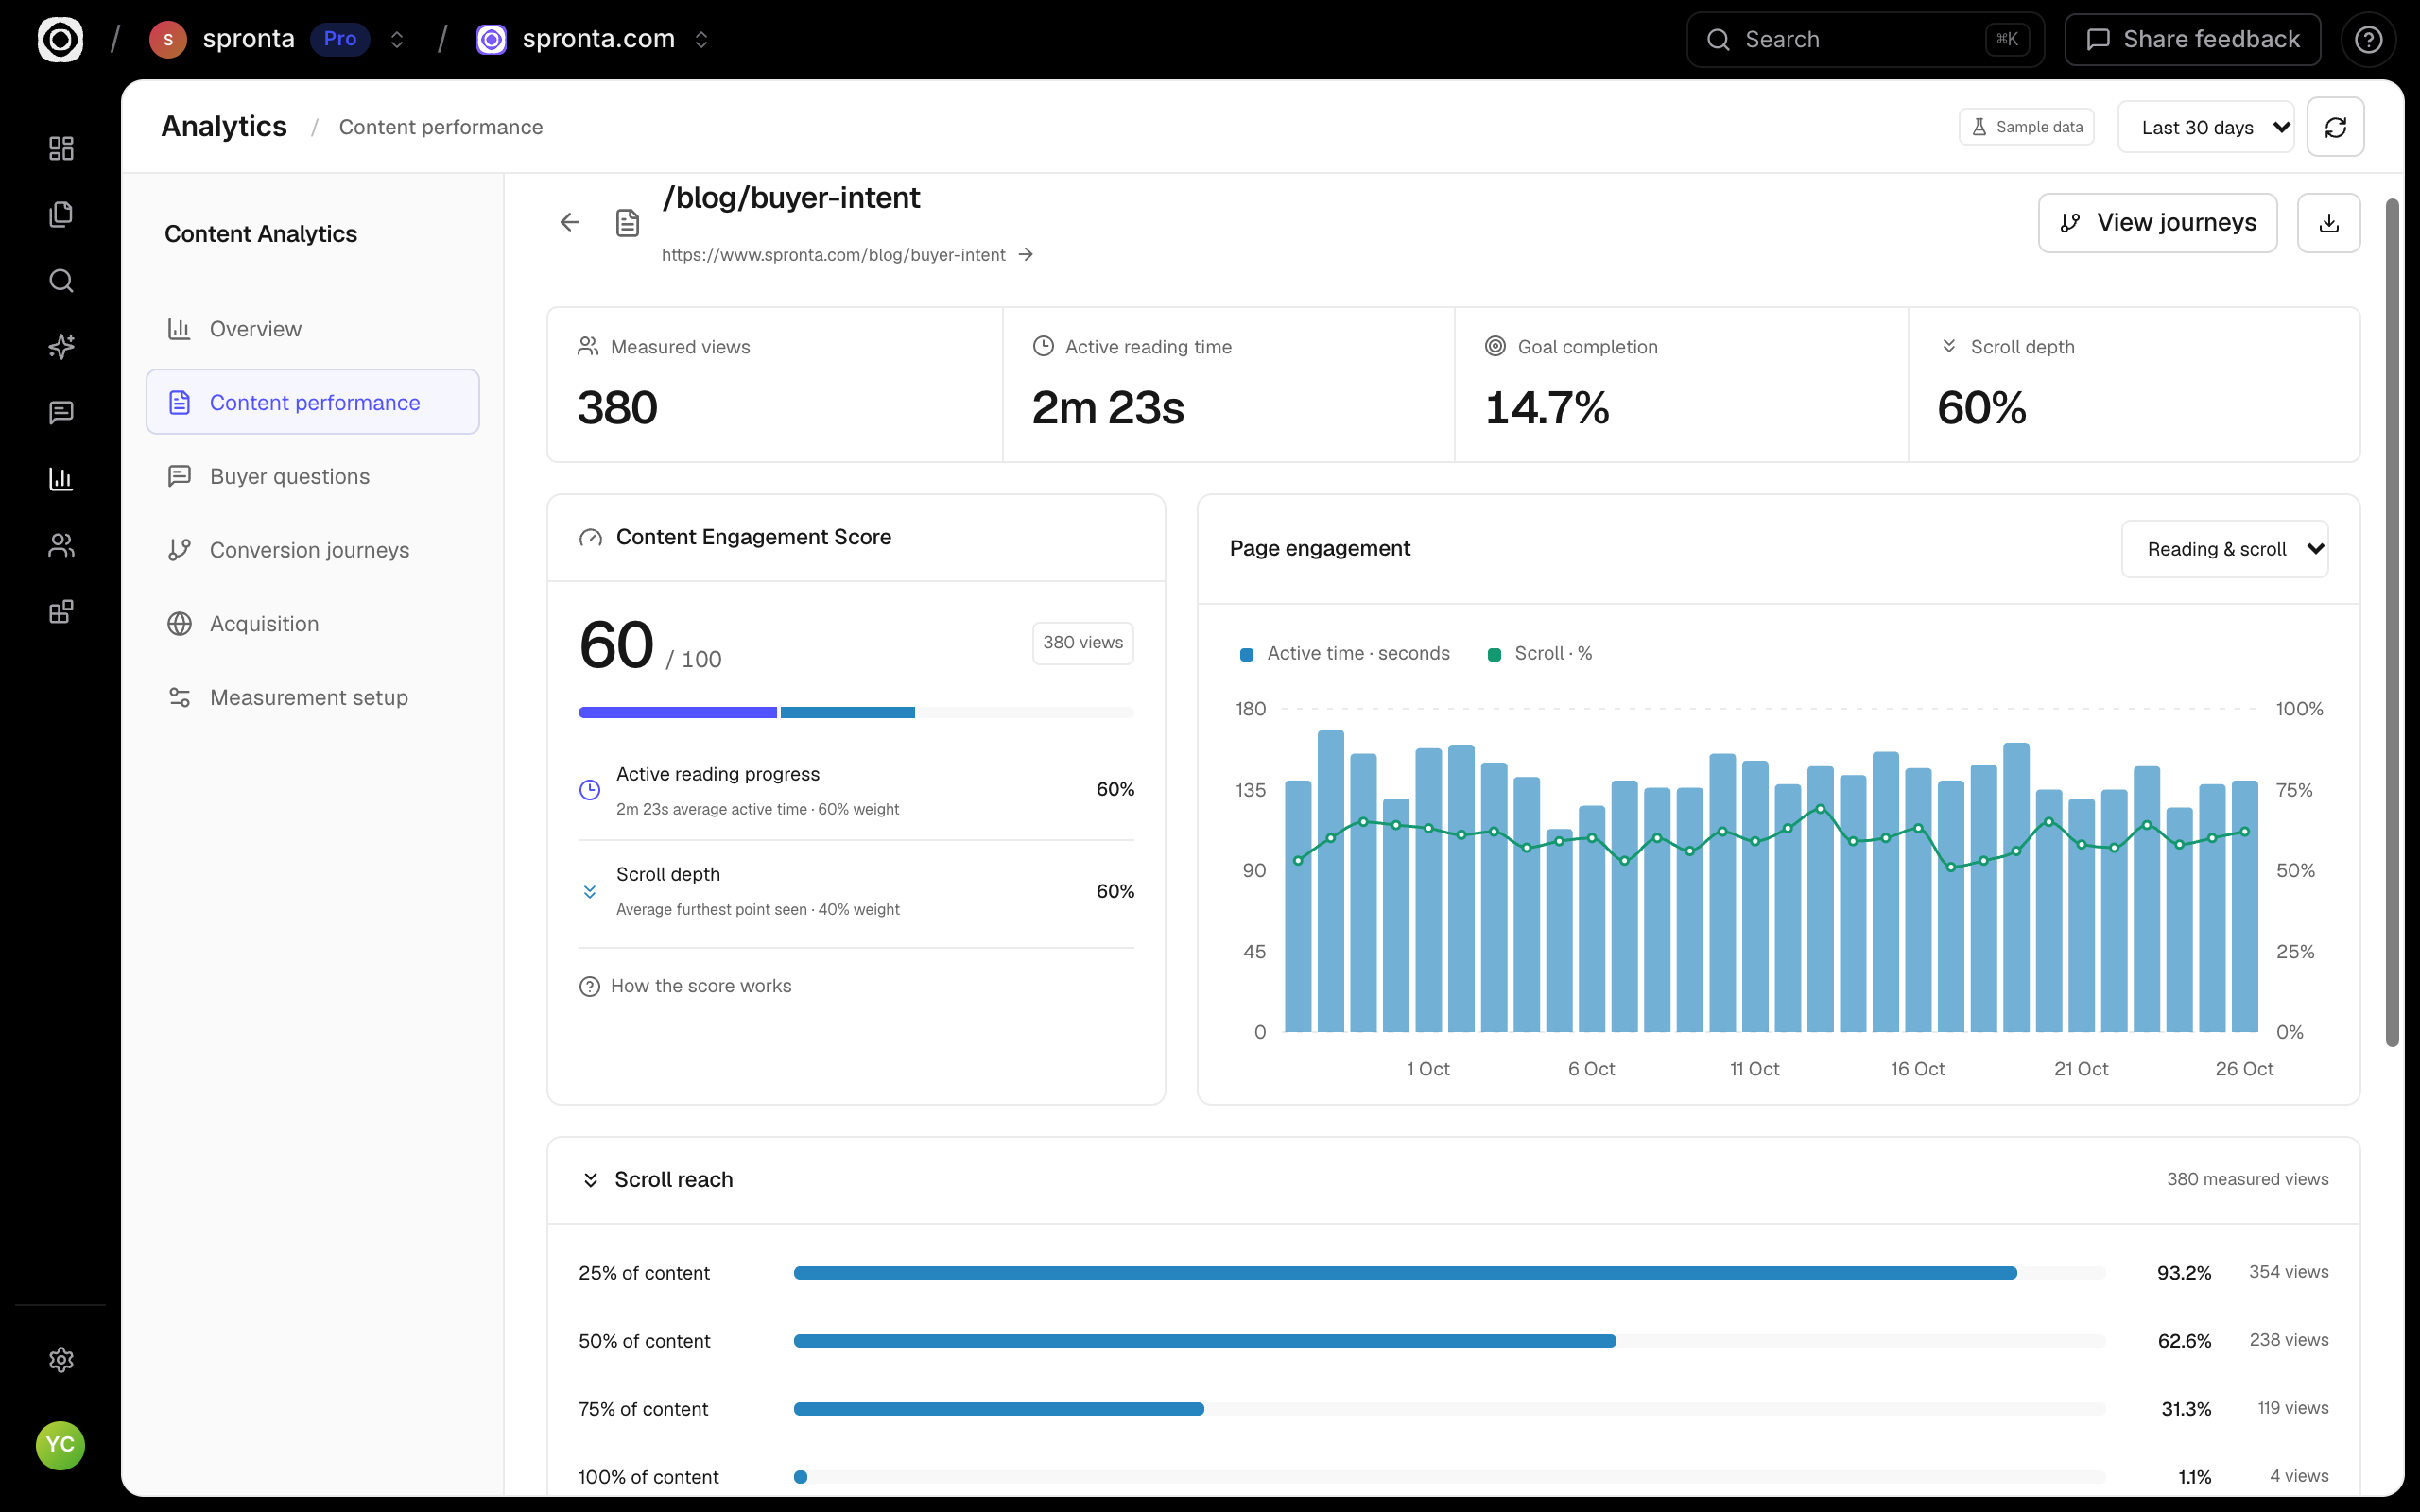
Know whether they actually stayed to read.
The Content Engagement Score combines active reading progress and scroll depth. See the underlying measurements beside the score, rather than treating a search click as engagement.
- 60% active reading progress · 40% scroll depth
- Daily reading and scroll trends, plus scroll reach
- Small samples are provisional; missing measurements stay missing
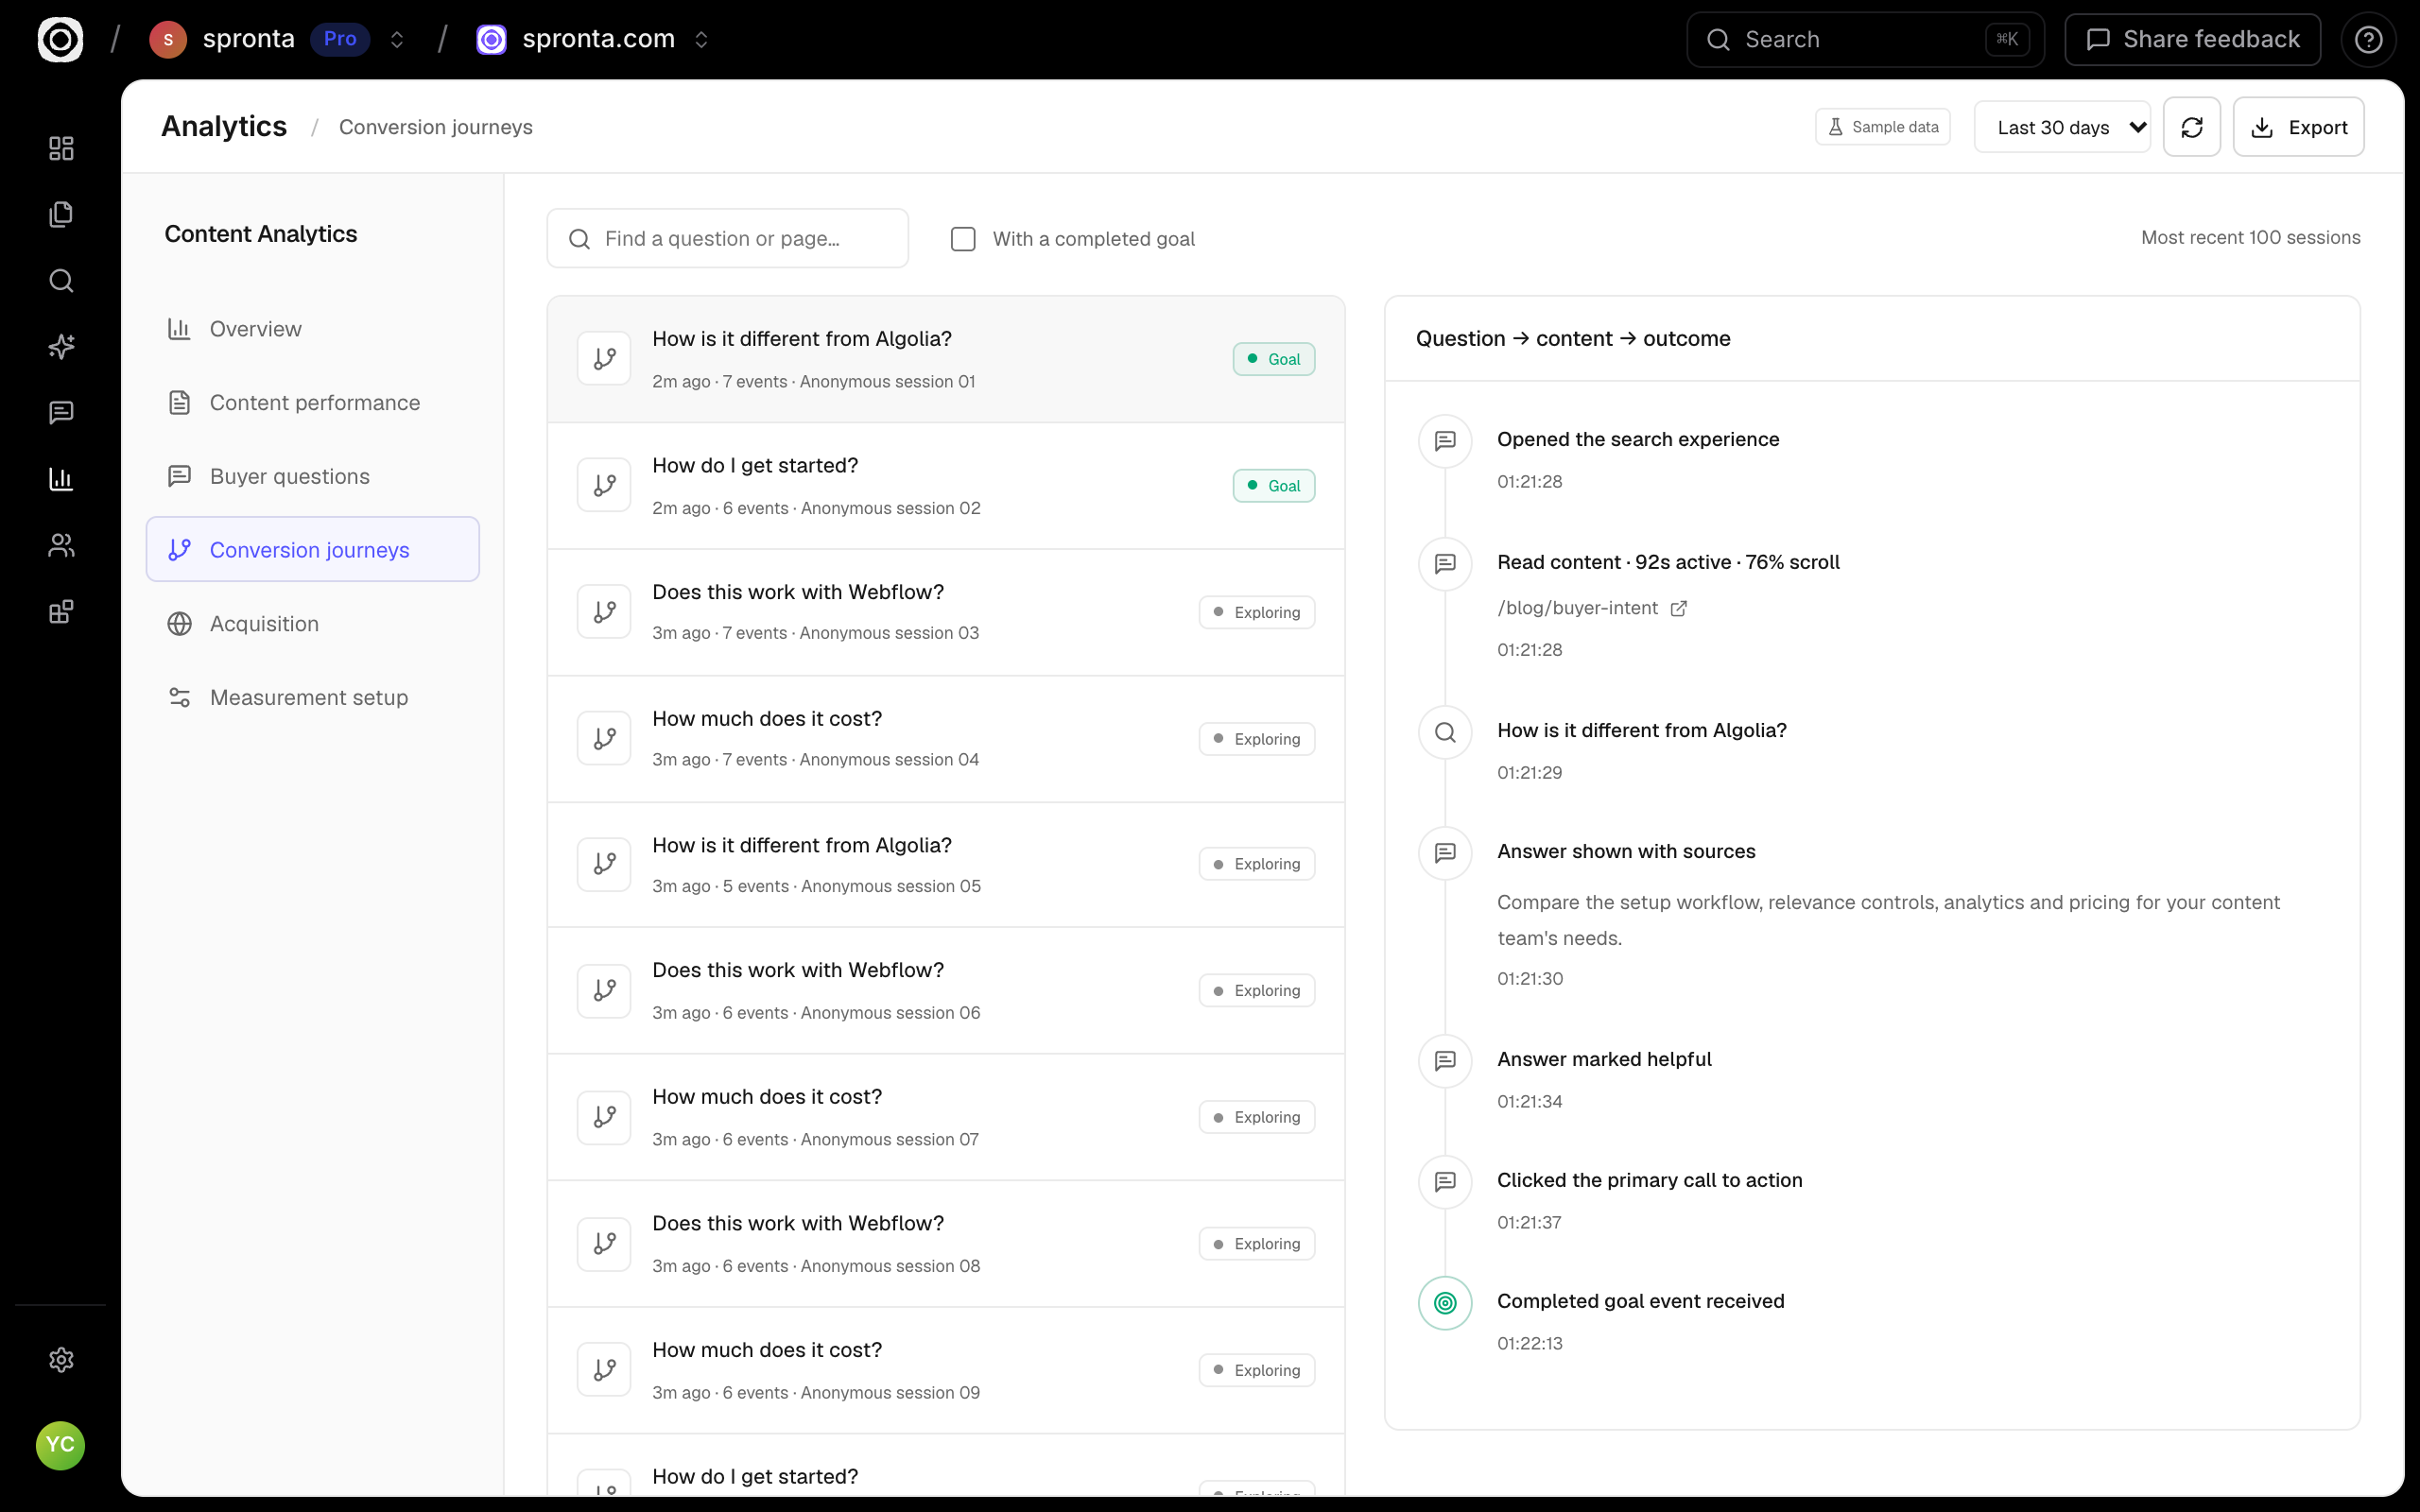
Follow the question through to the next step.
Inspect the search, content and goal events in a session. Use those journeys to understand assists, then confirm qualification, pipeline and revenue in your CRM.
- Inspect question → content → configured goal events
- 30-minute search-assist window, not proof of incremental lift
- Export activity for your own analysis
Simple to use.
Room to go deeper.
Find the unanswered buying questions.
Investigate searches that return no results or receive no clicks. Treat them as questions to investigate, not automatic proof that a new article is needed.
See where readers come from.
Explore acquisition context alongside content activity. Connect optional Google services for additional context without making them a prerequisite for first-party measurement.
Keep the outcome honest.
Configured goals show events from your forms and booking flows. Search assists use a 30-minute window. Qualified pipeline and revenue still need confirmation in your CRM.
Bring your content.
We’ll help it go further.
Find your platform ↗- 01
Connect
Choose your published website and the routes to include.
- 02
Make it yours
Test your content, configure the experience and review the widget.
- 03
Keep learning
Install the snippet and explore real visitor activity.
Pageviews are nice. Readers are better.
For people who publish things and want to know if anyone reads them. See reading time, scroll depth, reader feedback and the content in journeys to your configured goals.
Shopping around? Fair enough.
Here’s where we fit.
| The useful details | Spronta Content Analytics | Plausible Analytics |
|---|---|---|
| Primary focus | How people read, discover and respond to content | Website traffic, acquisition and conversion analytics |
| Engagement | Active reading time, scroll depth and reader feedback | Automatic scroll depth and user journeys |
| Outcomes | Content journeys and goals you configure | Goals, funnels, revenue and campaigns |
Spronta starts at $29/month for 100,000 pageviews. Both products help investigate outcomes. A tracked goal is not proof of qualified revenue; confirm that in your CRM.
Public information checked 27 October 2026. Plausible features ↗
Big on insight. Clear on price.
Choose your monthly pageviews. Reading, scrolling and feedback are part of the same visit.
One tracked page visit counts as one pageview. Reading time, scroll depth and feedback do not add extra pageviews.
Compare all product prices ↗Billed monthly. Change your usage level as you grow.
Enter a whole number from 100,000 to 10 billion.
Start with Content Analytics →Estimate for this product only. Your selection carries through to signup.
Good questions. Clear answers.
A closer look at Spronta Content Analytics.
How is the Content Engagement Score calculated?
It combines active reading progress (60%) and scroll depth (40%). The underlying measurements remain visible. Scores below 20 measured views are provisional, and a page without measurements is not given an invented score.
Do you measure people who did not use search?
Reading and scroll measurement includes measured page visits from direct visitors as well as search users, subject to the installation and consent settings. Search clicks are not substituted for reading time.
Can Spronta track demo conversions?
Content Analytics supports goal events from your existing forms and booking flows. Your team must implement those events. A CTA click is not the same as a completed booking or verified CRM revenue.
Are the figures on this page real customer results?
No. These are screenshots of the actual product using explicitly labelled sample workspace data, not customer performance claims.