Platform update
Search Console as a plugin, issue history, and Search analytics
· by Sean Ryan
Three updates this week, one theme: closing the gap between what Spronta finds in a crawl and what actually happens to your site afterwards.
Google Search Console is now a plugin
A crawl tells you whether a page is healthy. Search Console tells you whether anyone finds it. Now you get both in one place.
- Connect your sites in a couple of clicks. Open Plugins in app.spronta.com, connect Google, and link a verified property to a project. The permission is read-only — Spronta can’t touch your site or your Search Console settings.
- Google performance beside every crawled page. Clicks, impressions, click-through rate and average position, joined per URL in the Discoverability view of every report.
- Insights, not just numbers. Spronta reads the two datasets together and flags patterns like visible, but under-clicked — a page ranking on page one whose snippet isn’t winning the click — so you know whether to fix the content or the title.
- Agents get it too. With the plugin linked, the hosted MCP server’s
search_performancetool joins live Google data onto any saved report.
Issue history: when it started, how it spread
Every issue now carries its own timeline, tracked across your crawls. You can see when it was first detected, when it last changed, and how the number of affected pages has moved crawl over crawl — so “did last week’s deploy cause this?” and “is it getting worse?” are answered right on the issue page, not by diffing old reports.
Analytics for Spronta Search
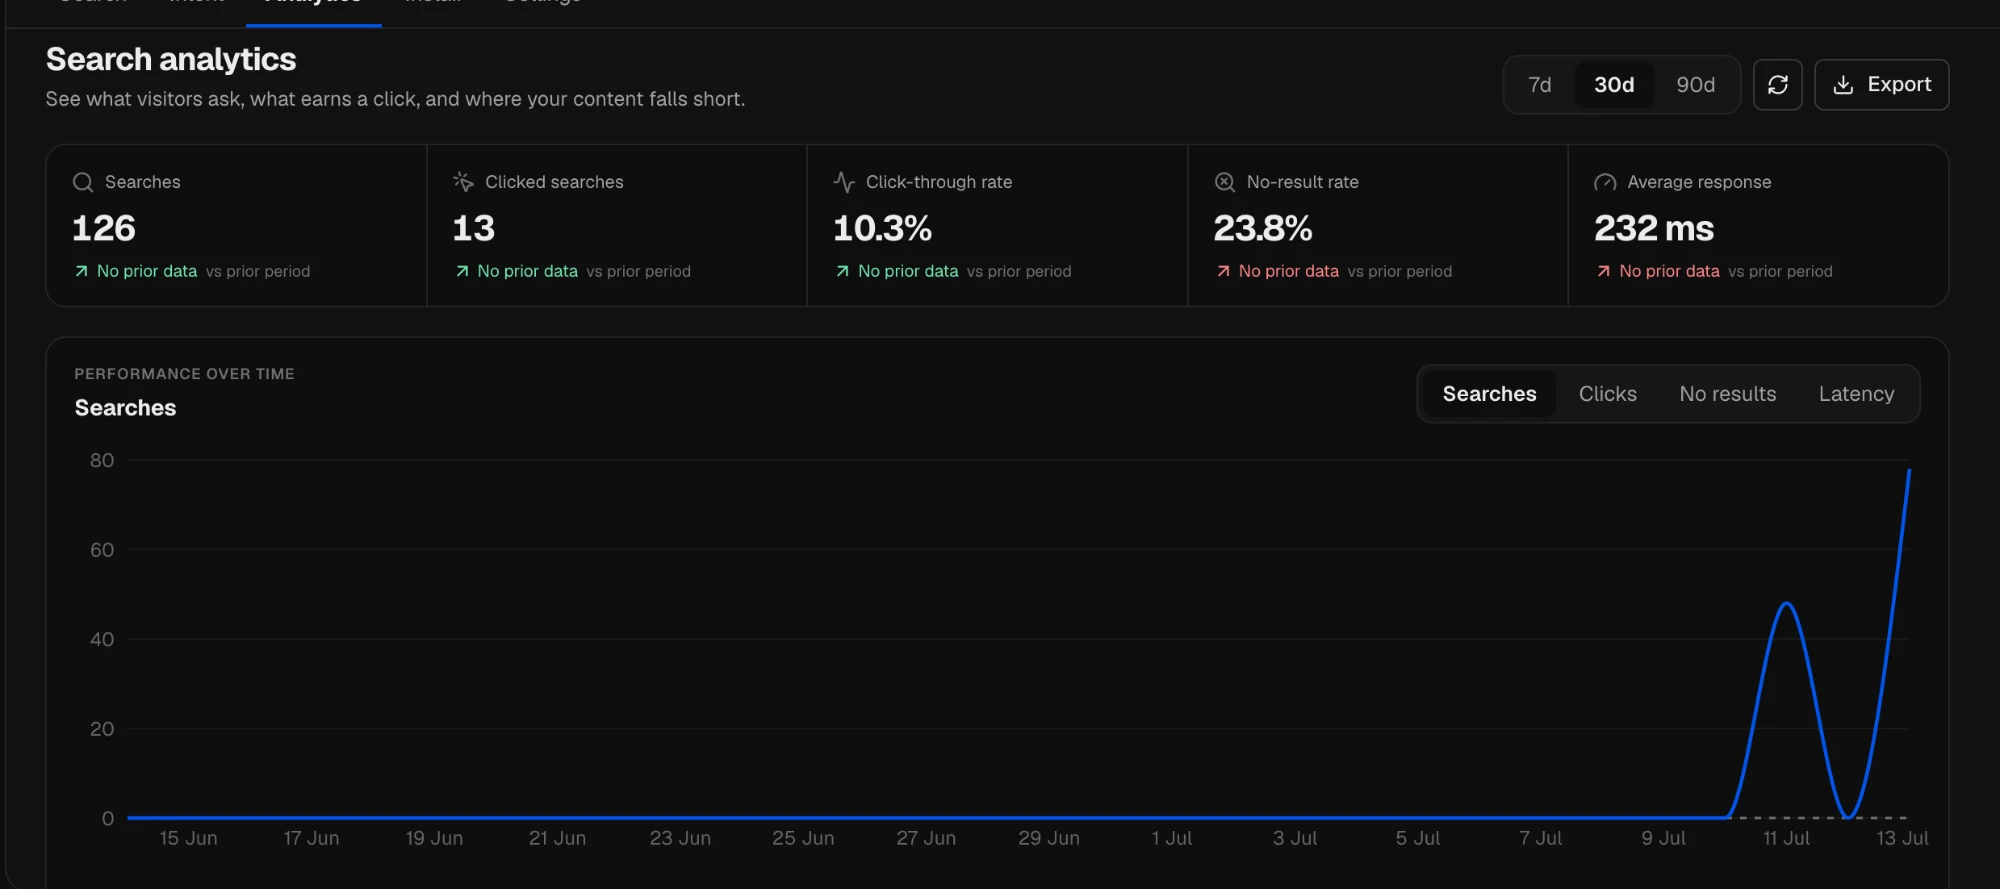
Spronta Search got an Analytics tab: searches and clicked searches over time, click-through rate, and response time, over 7, 30 or 90 days. Best of all is the no-result rate — the queries your visitors ran and got nothing back. That list is your content gaps, written by your own audience.